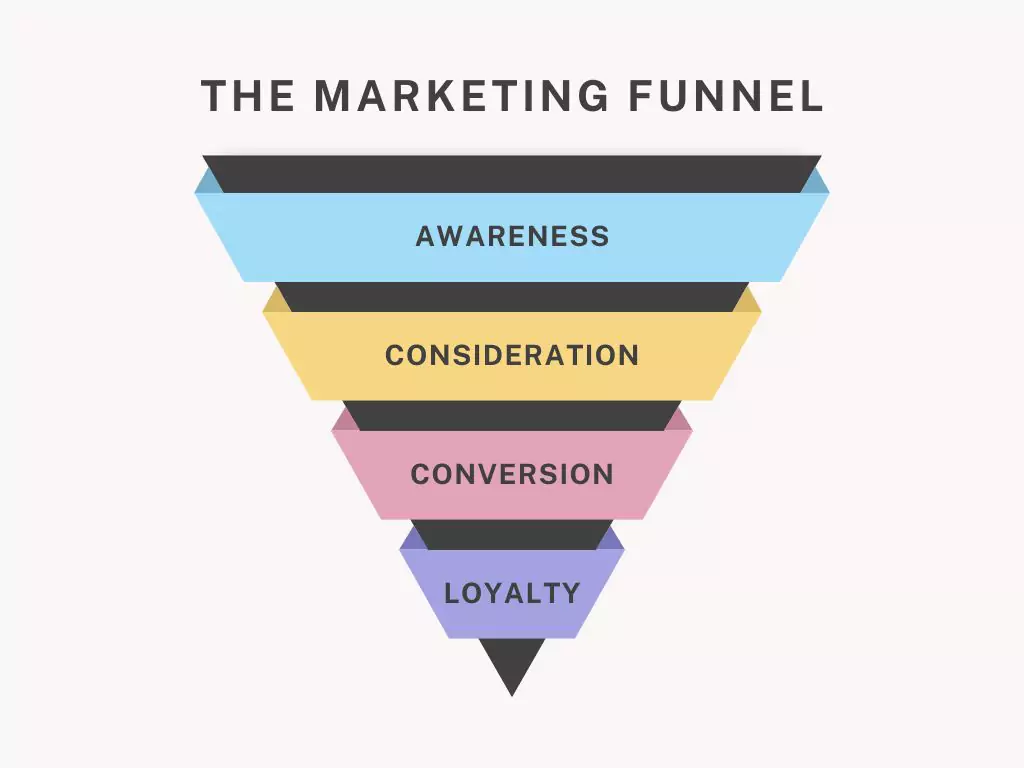
What is the Conversion Rate?
Conversion rate [CR] (which I hear thrown around a lot…fancy schmancy metric measuring percent specific groups that do something) Conversion (standard in the context of a sales funnel = % of ppl that enter into it actually make a purchase. An example is — the conversion rate from the website’s average user that ends up converting into an e-commerce transaction[0-All Users, or also defined by pages
Lastly, several key conversions in UX and Conversion Rate Optimization, such as product-to-checkout and cart-to-purchase conversion rates, are critical for success and optimizing revenue.
A repeated version of this is commonly referred to by advertisers as Click-Through Rate (CTR). This rate measures the ad views it has triggered and, therefore, is an important reflection of your engagement. Likewise, a conversion rate compares two different metrics.
A conversion rate is confidently calculated for any action where you want to determine the percentage of total people who could take that action and actually did. The labels provided for the inputs of our conversion rate calculator serve as guidance, allowing you to input any two relevant sets of numbers.
Conversion rates require the right denominator and should be measured using proper metrics. When optimizing the online shopping cart experience, for example, you should not include users who never viewed the cart in the baseline when measuring your cart-to-checkout conversion rate. This way, you get a better measurement and more of the right changes.
Since most subscription services and SaaS websites serve current paying customers as well as potential customers, it is vital to exclude current customers from the baseline because they cannot convert unless upgrades are viewed as conversion events.
Conversion Rate Formula
Conversion rate is an easy way to tell if something is rockin’ or not. You calculate it by adding together the number of times something critical happens, e.g., ad clicks or sales, and then dividing that by your total persons. So, for example, you can contrast the number of ad clicks for ad views or sales versus the total number of visitors that came to your website.
We generally convert these conversion rates to percentages so you can more easily digest them. To save your sanity, this is where you can dissect how well your A/B tests are doing or see which lead sources work and at what rate different user groupings fall into. It is all about figuring out the most effective technique for you!
The CR formula used in our conversion rate calculator is:
Conversion Rate = (Events / Visitors) x 100.
The multiplication by 100 is for converting simple to a percentage rate. The math is elementary.
Practical examples
Below are some examples of places where sales and marketing will need to get conversion rates from their intended forms of content.
Example 1: Calculating e-commerce conversion rate.
Google Analytics data, the e-commerce conversion rate of an online shop in the last month, is accurate (it can be calculated). To sum up this period, the site signed 10,000 users and completed 150 e-commerce tasks. The conversion rate is calculated by/ simply taking the number of transactions (150) and dividing the whole value by the number of site visitors (10,000), which gives us a result of=0.015. When you take this and multiply it by 100, it informs us that our conversion rate is a mighty 1.5%!
It is essential to interpret results from further calculations in a very cautious way. Users might place multiple orders in time for one user, resulting in the additional complication of “percentage of users who purchased.” But to correctly measure that conversion rate, you have to track actual users who completed a purchase( click) instead of eyeballs across all your e-commerce transactions. However, digging this deep into details may sound redundant if few customers repeat purchases each month, to be honest, if you value the accuracy.
Example 2: Calculating shopping cart conversion rate

Let me put it this way: you can have a goal set up to show the sessions people have when they hit the checkout of an online store. When working to improve that conversion rate via A/B testing of a new shopping cart experience, you will have to figure out the sample size needed to make a statistical difference in your test. In order to get that, you need to know how much a visitor will convert from cart to check out (or whatever your baseline is). As you are looking at user-level metrics, what you want to know is the percentage of users who see the cart go on to the checkout.
We start with our visibility data from the web analytics tool in order to identify the conversion rate.
300k users saw the cart, and 30k clicked through to the first step in checkout in the last three months. We end up with a conversion rate of 0.10 (10% when we convert the decimal to a percentage) by dividing 30,000 by the total 300,000. As always, when working with this sort of data, similar limitations apply to Example 1: users might have interacted with the cart and checkout page multiple times over this period. However, our CR calculator is there to handle these calculations easily.
Change of conversion rate over time
In reporting the evolution of conversion rates, we need to know that using just arithmetic averages is not going to cut it properly. Because it is the rate of change and ratio, using a geometric average is necessary for getting the right results. It also works for computing average annualized return, so you are not just skimming the surface in terms of performance.
